Advanced Year-Specific Data Analysis and Filtering in Excel: A Professional Approach
For data professionals, mastering Excel’s filtering capabilities for year-based analysis requires going beyond basic filters and formulas. Here, I’ll break down techniques that deliver precision, automate repetitive analytics, and provide strategic insight—reflecting the standards expected of top-tier analysts.
The Business Case for Sophisticated Year-Based Analysis
Robust time-series analysis in Excel empowers organizations to:
- Conduct detailed YoY, YTD, and rolling period comparisons.
- Build dynamic reports for forecasting and anomaly detection.
- Isolate seasonality and structural breaks within large datasets.
Advanced techniques are vital for reducing manual errors, accelerating monthly and annual closes, and facilitating strategic decision-making.
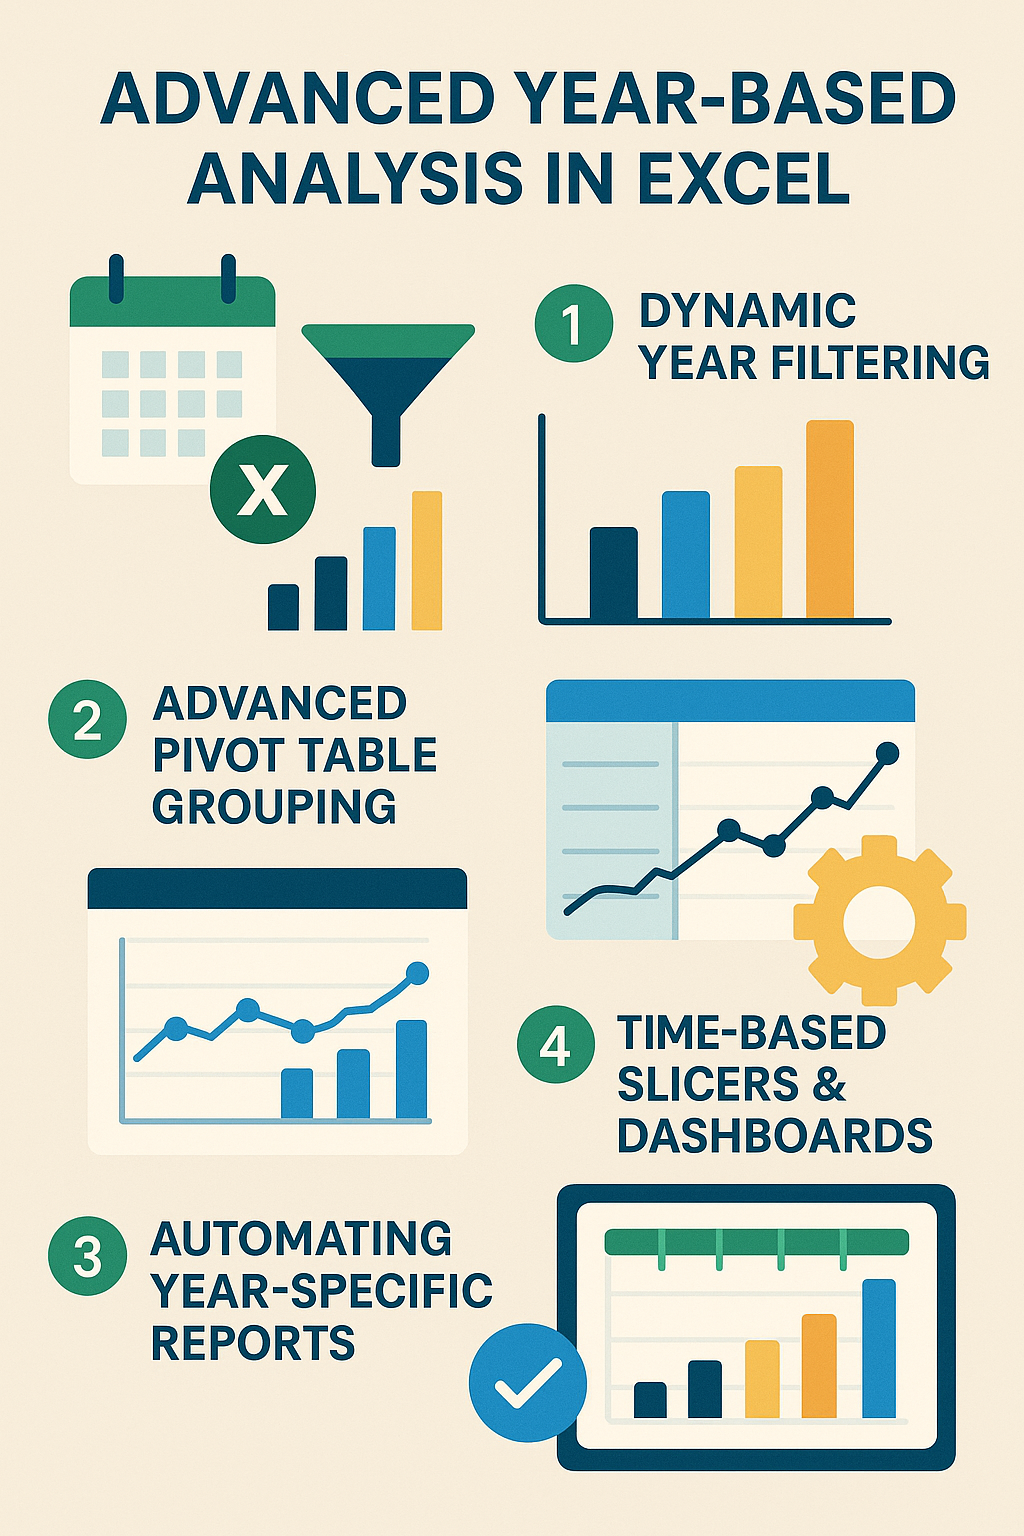
1. Dynamic Year Filtering with Structured Formulas
Complex data often requires reusable, adaptive filtering. Move beyond =YEAR() by integrating structured and nested formulas:
- Extract and Normalize Year Data
- text
=IF(ISNUMBER([@Date]), YEAR([@Date]), NA())
- text
- Parameterize Year Selection for Scalability
- Define a cell (e.g.,
G1) as your target year input. Then: - text
=([@Year]=G$1) - This approach automates year-based filtering across variable datasets—ideal for dashboards or recurring reports.
- Define a cell (e.g.,
2. Advanced Pivot Table Grouping and Time Intelligence
Grouping Multiple Time Dimensions:
- Right-click the date field in your Pivot Table and choose “Group…”
- Select both “Years” and “Quarters” or “Months” for multi-tiered time analysis.
Implement YoY Calculations:
- Add a “Year” and “Period” to Rows, and your metrics to Values.
- Create custom “Difference from” calculations, e.g., show percentage change vs. previous year. Example custom field formula:
- text
= (This Year Value - Last Year Value) / Last Year Value
- text
- For more flexibility, leverage Excel’s “Show Values As” options (e.g., “% Difference From,” “Running Total In”) to automate complex YoY visualizations.
3. Automating Year-Specific Reports with Power Query
Harness Power Query (Get & Transform) for scalable, repeatable data processing:
- Filtering Rows by Year
- Use Power Query’s “Add Column” → “Year” extraction.
- Filter your data dynamically via parameters, allowing users to select reporting years without altering queries.
- Combine and Append Yearly Data
- Automate consolidation across multiple files or tables for multi-year comparison.
- Schedule refreshes for up-to-date analytics without manual intervention.
- Error-Handling in ETL:
- Add conditional columns for missing, malformed, or outlier date entries.
- Log rejected rows for audit-ready transparency.
4. Time-Based Slicers & Interactive Dashboards
Deploy timeline slicers in Excel dashboards for user-driven year filtering:
- Insert a PivotTable Timeline and connect to your main table.
- Use multiple, synchronized slicers (years, sub-periods, regions) for granular drilldown.
Pro Tip: Use VBA to automate time-slicer defaults based on the current system date or reporting cycles for end-user convenience.
5. Real-World Mistakes and Mitigations
- Non-Date String Pitfalls: Always validate data import stages—malformed strings derail grouping and calculations.
- Fiscal vs. Calendar Years: Use formulas or Power Query conditional logic to align with your organization’s unique fiscal calendar.
- Leap Year/Week Handling: For week-based metrics, consider Excel’s ISO.WEEKNUM for accurate period alignment.
| Pitfall | Mitigation Strategy |
|---|---|
| Date format inconsistency | Normalization in Power Query or with formulas |
| Timezone offsets/data lag | Convert to UTC or desired base before analysis |
| Historic corrections/revisions | Version-control data sources, use comments/logs |
6. Elevate with Excel + Power BI Integration
For large or enterprise-grade datasets:
- Use Excel tables as a data source in Power BI for advanced DAX time intelligence.
- Implement calculated columns or measures to identify YoY trends, moving averages, or custom KPIs—synchronizing insights across platforms.
Conclusion
True mastery of year-specific analysis in Excel means combining structured formulas, dynamic pivots, Power Query, and interactive dashboards, ensuring robust, error-resistant, and scalable reporting pipelines. This methodical, professional approach goes well beyond the basics—positioning you as a strategic data leader and Excel reference in your organization.
Further Reading: Advanced Year-Based Data Analysis in Excel
Explore expert guidance, tutorials, and specialized solutions on advanced year-specific filtering, dynamic dashboards, and automated reporting in Excel. Each resource below offers actionable techniques or conceptual depth for professionals.
- Excel Automation with Macros & VBA
Discover how to automate repetitive tasks and optimize your Excel workflow using powerful macros and VBA scripting.
Read: Boost Productivity with Excel Macros and VBA - Advanced Data Management in Excel Spreadsheets
Master advanced techniques for data consolidation, filtering by specific years, and creating summary workbooks for large datasets.
Read: Data Management and Year-Specific Analysis in Excel
Official Microsoft Resources
- Create a PivotTable to Analyze Worksheet Data
Learn how to summarize, filter, and visualize worksheet data with PivotTables—a cornerstone for time-based analytics in Excel.
Read more - Overview of PivotTables and PivotCharts
Excel’s PivotTables and PivotCharts enable you to drill into time-series data, add interactive timelines, and present summary data visually.
Read more
Specialized Tutorials
- Filter by Date – Excel Formula Examples (ExcelJet)
Practical advice on filtering by year or date using formulas like FILTER, YEAR, or custom date logic.
Read more - Power Query Date Formats (My Online Training Hub)
Extract year, month, and custom time periods with Power Query for dynamic and robust date filtering in reports.
Read more - Make Dynamic Dashboards Using Excel (Chandoo.org)
Step-by-step on integrating PivotTables, Slicers, and timelines for interactive, year-driven dashboards.
Read more
Automation and Reporting
- Excel Calculations: Automatic, Manual, Iterative (AbleBits)
Deep dive into controlling how Excel recalculates formulas, ideal for ensuring accurate annual updates and multi-year reports.
Read more
Dashboards and Fiscal Year Adjustments
- How to Create a Dynamic Excel Dashboard in Just 5 Steps (Chandoo.org)
Detailed guide for professional dashboard construction, with a focus on year-by-year analysis using slicers.
Read more - Excel Calendar Template – Custom Fiscal Year Planning (Excel.TV)
Learn to design fiscal calendars and adapt Excel templates to support advanced year analysis and business-specific date frameworks.
Read more


